Data That Drives Decisions
Custom Dashboards for
Complete Case Insight
Measure What You Treasure and Gain Clarity at a Glance
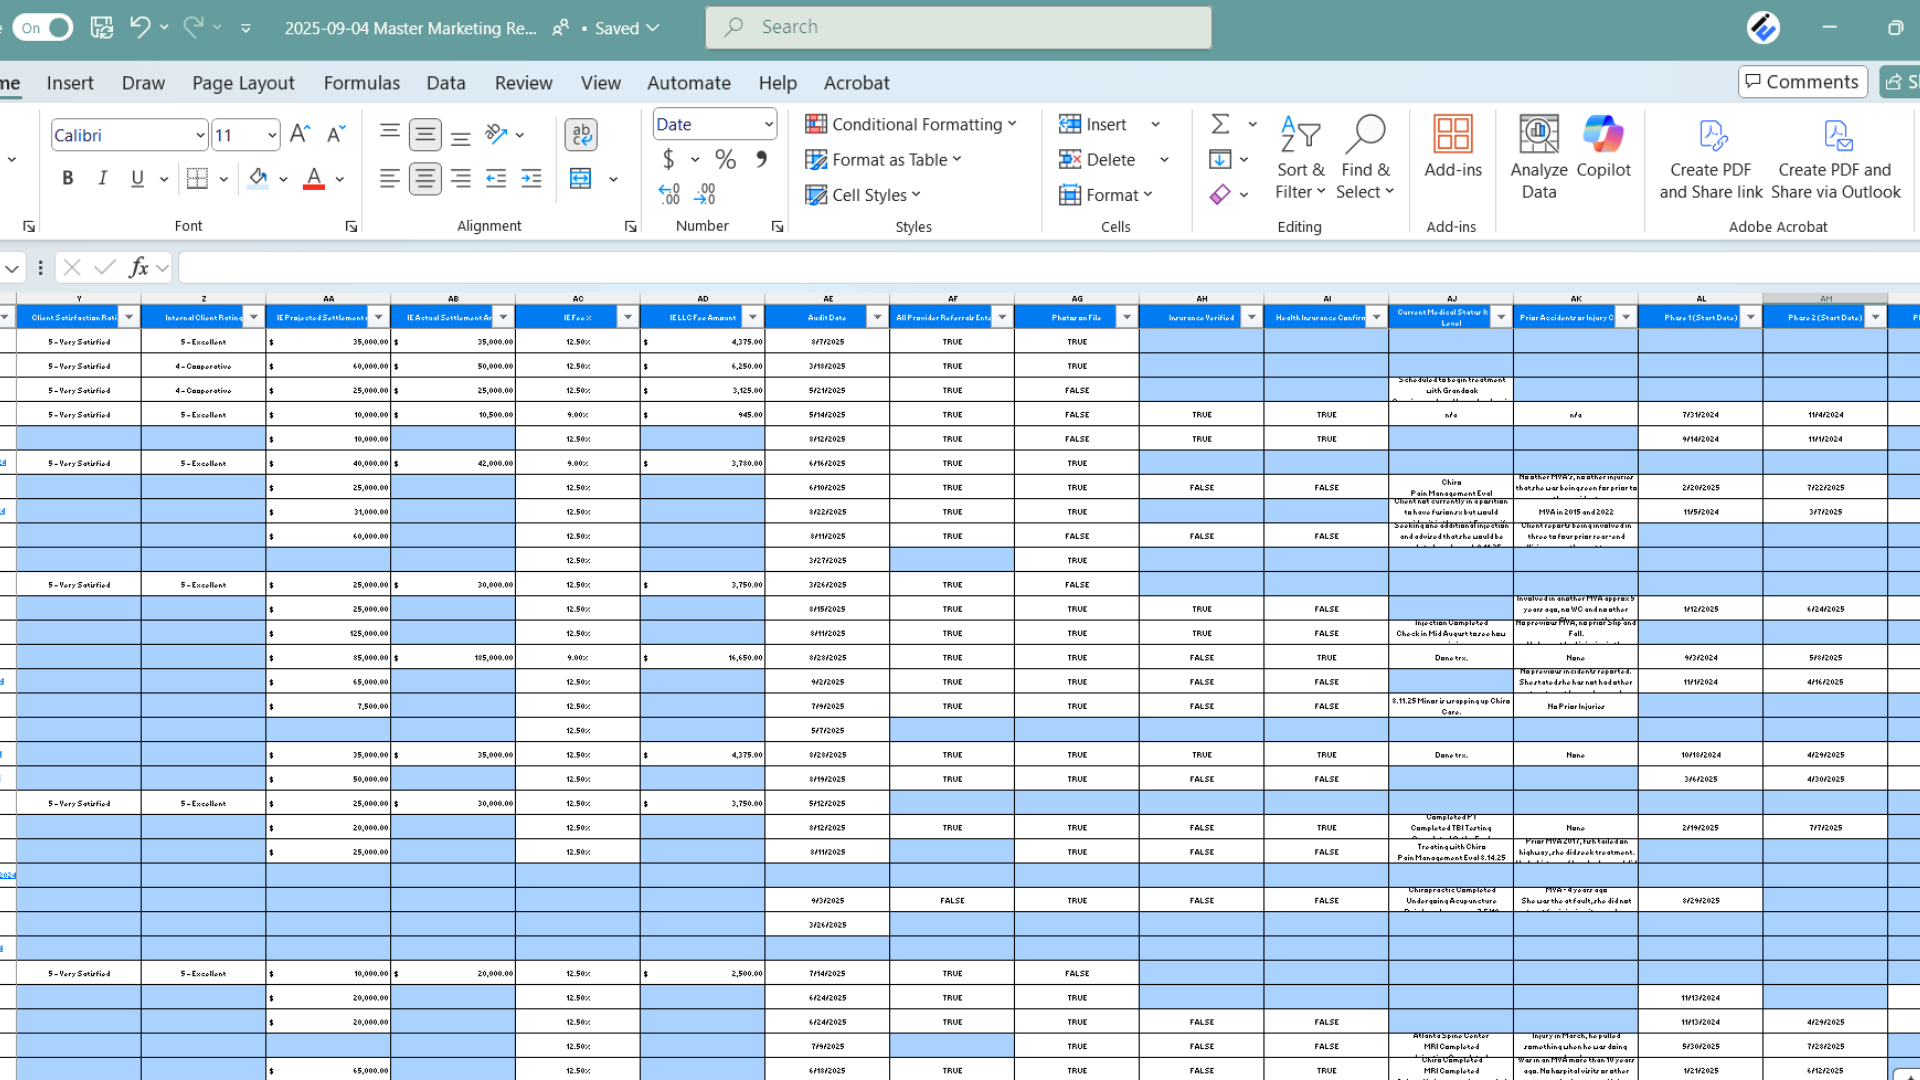
Raw data is the foundation of every strong case strategy. Spreadsheets capture treatment timelines, records status, financial details, and settlement projections. For a law firm, this information can be one of the most useful tools for growth and consistency, ensuring that nothing important is overlooked and every case stays on track.
But while spreadsheets contain the answers, they are not always easy to interpret quickly. When an attorney or case manager needs to know if a file is ready for demand or how a case is trending in value, scanning through rows of numbers can be overwhelming. That is why transforming raw data into a clear visual dashboard is so valuable. It allows firms to measure what they treasure and gain instant clarity on the full scope of every case.
Measure What You Treasure
The phrase measure what you treasure captures the heart of effective case management. Every case has dozens of moving parts, but not all of them carry the same weight when it comes to outcomes. By focusing on the details that matter most, such as treatment progress, records requests, timelines, and communication, firms can keep the right information at the center. When you measure what is most valuable, you gain clarity and confidence in every decision.
When you measure what you treasure, you gain control over case value, demand readiness, and outcomes.
From Data to Visualization
Numbers alone do not tell the whole story. Data only becomes useful when it is arranged in a way that makes patterns and priorities clear. Visualization turns spreadsheets and raw figures into something meaningful, allowing attorneys and case managers to quickly spot trends, monitor progress, and focus on what matters most. By turning information into clear graphics, firms gain a sharper view of their cases and can act with greater confidence.
Key Points
-
Track demand readiness
-
Visualize case value
-
Customizable for attorneys
-
See last client contact
-
Insight at a glance
-
and more...
Creating the Dashboard
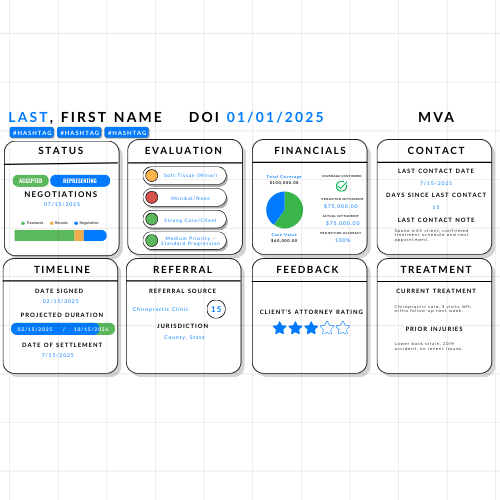
The example on the left shows how a single dashboard can capture the full scope of a case. Status, evaluation, financials, treatment, contact history, and referrals are all displayed together in one view. Instead of searching through multiple files or screens, attorneys and case managers can see every parameter of the case in seconds. This type of dashboard makes it easy to understand readiness for demand, project settlement value, and track overall case health with confidence.
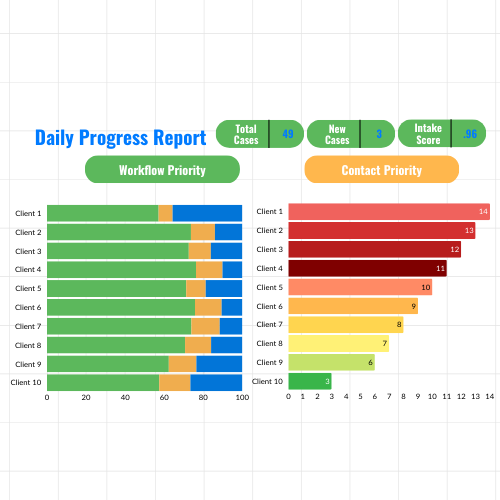
The example on the right highlights how dashboards can also prioritize daily work. By ranking clients based on workflow needs and recent contact, the system shows which cases require attention first. This ensures no client is overlooked and that communication remains consistent, even when caseloads are heavy. Together, these graphics demonstrate how raw data can be transformed into actionable insights that drive both efficiency and stronger client relationships.
Seeing the Bigger Picture
Dashboards are more than charts and numbers. They are tools that bring the story of each case into focus. By concentrating on the right metrics, optimizing systems, and building tailored dashboards, firms gain the clarity needed to guide clients, strengthen negotiations, and improve outcomes. When you measure what you treasure, every case receives the attention and direction it deserves.
Project Information
This project demonstrates how data-driven dashboards give attorneys and case managers a complete view of their cases at a glance. By identifying the right metrics, optimizing the case management system, and creating custom dashboards, firms gain actionable insights into case value, demand readiness, and overall progress.